Stationsplein 5, Zwolle
Support@CodeGlass.io
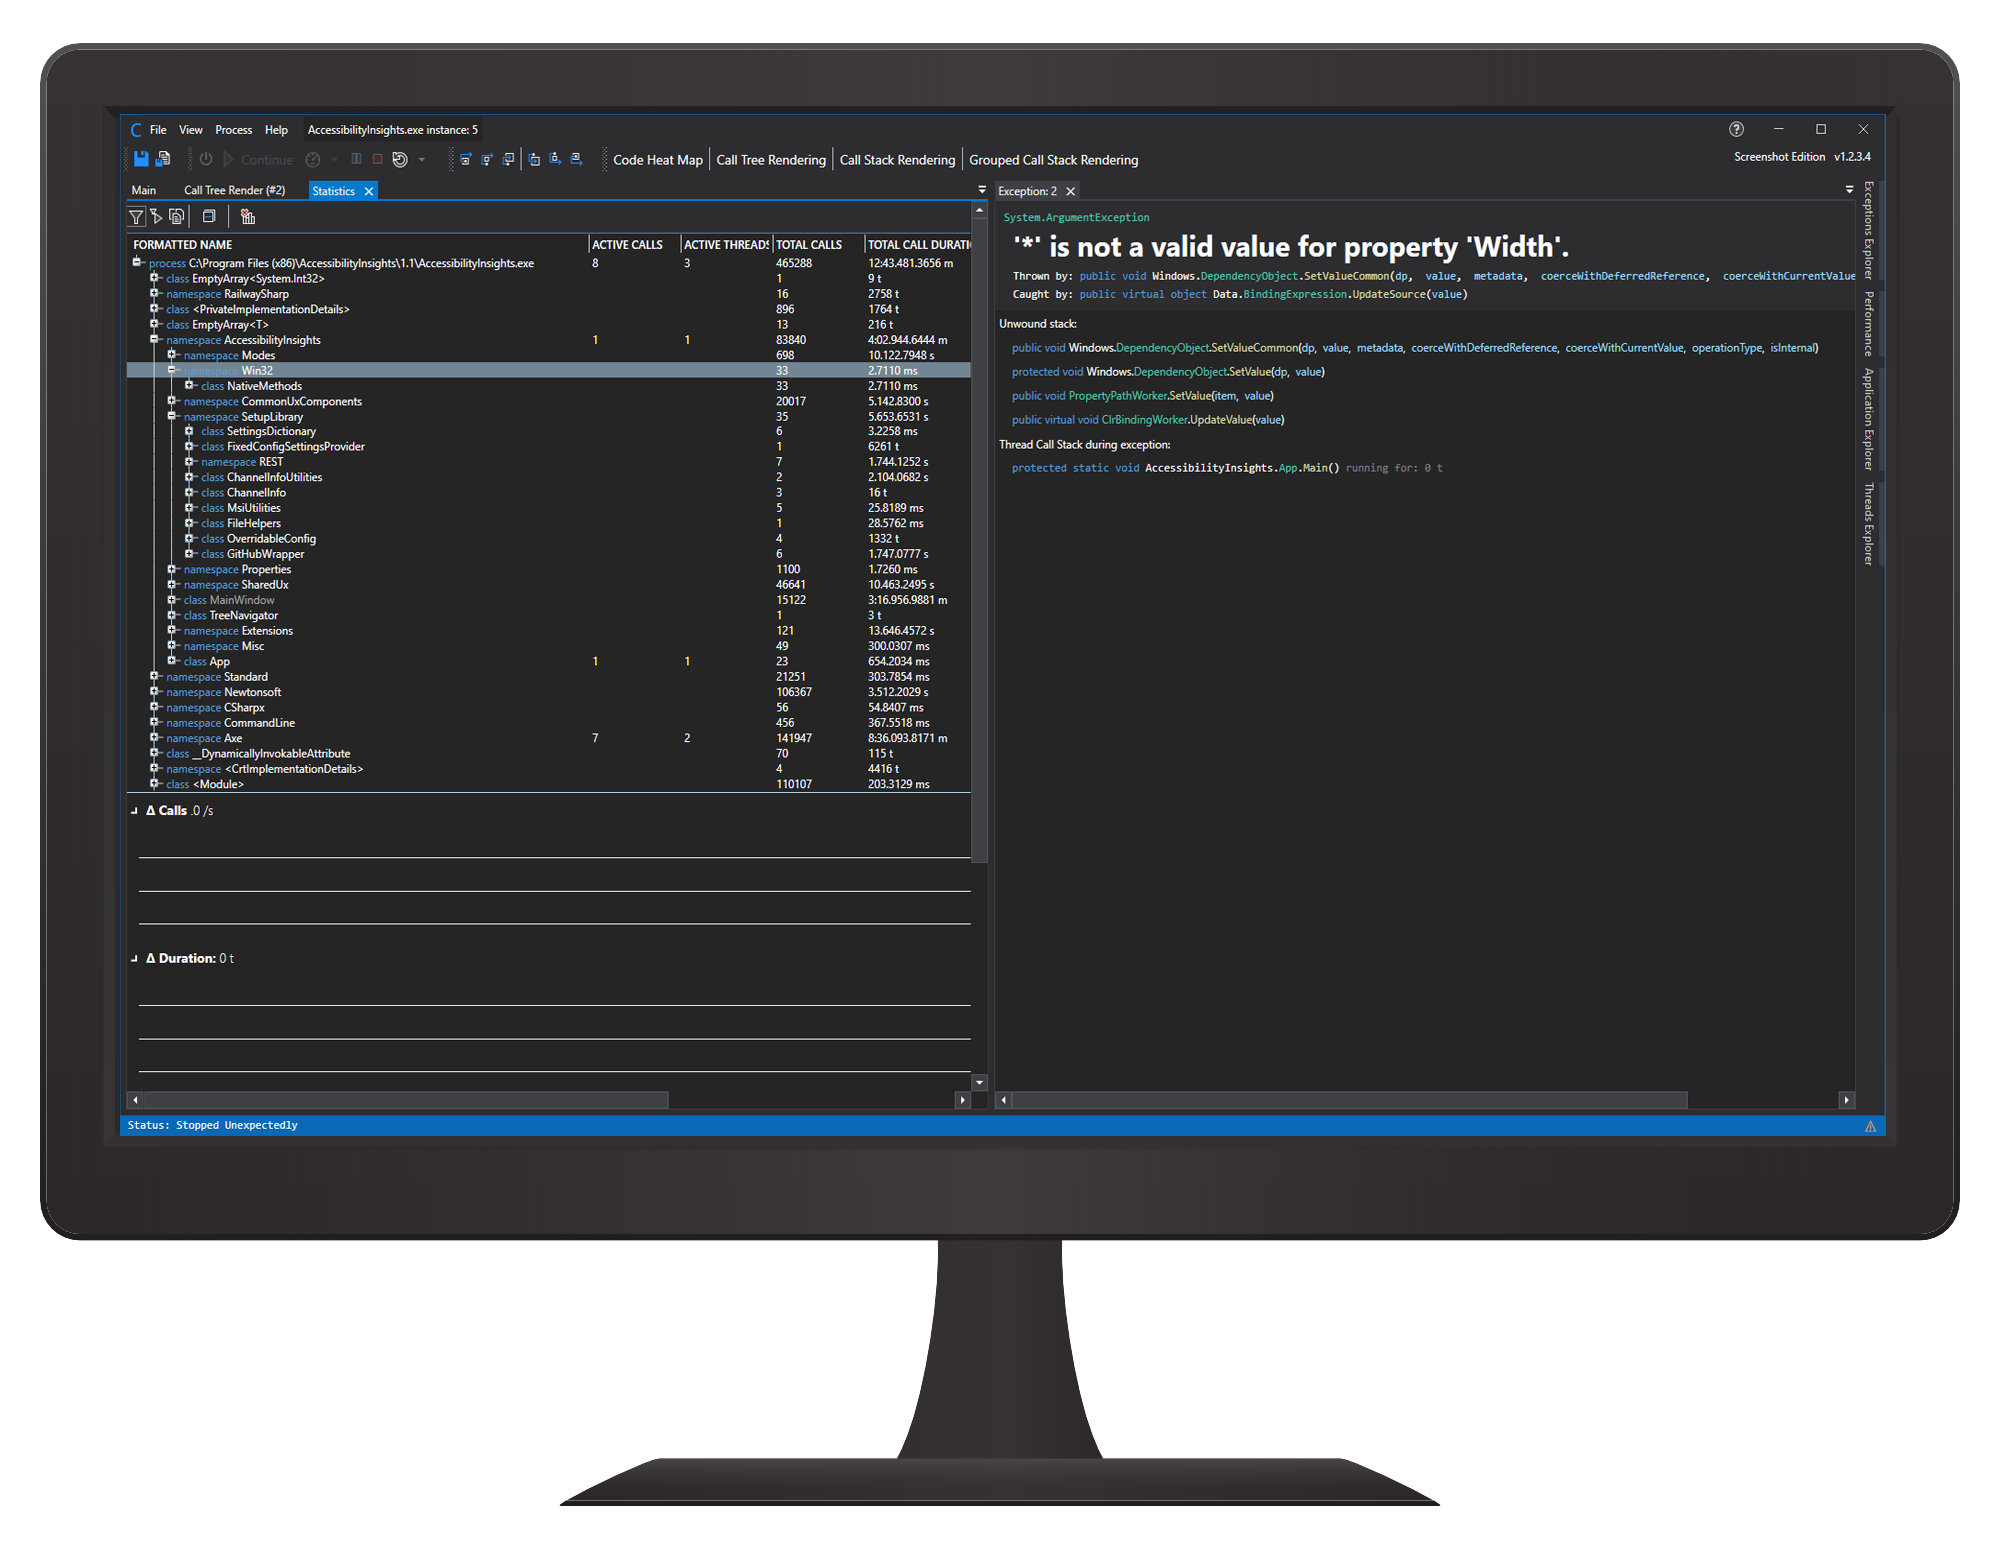
Reproduce any bug.
No sourcecode required.
Currently, we support .NET applications and JavaScript* websites.Support for more runtimes comming soon.
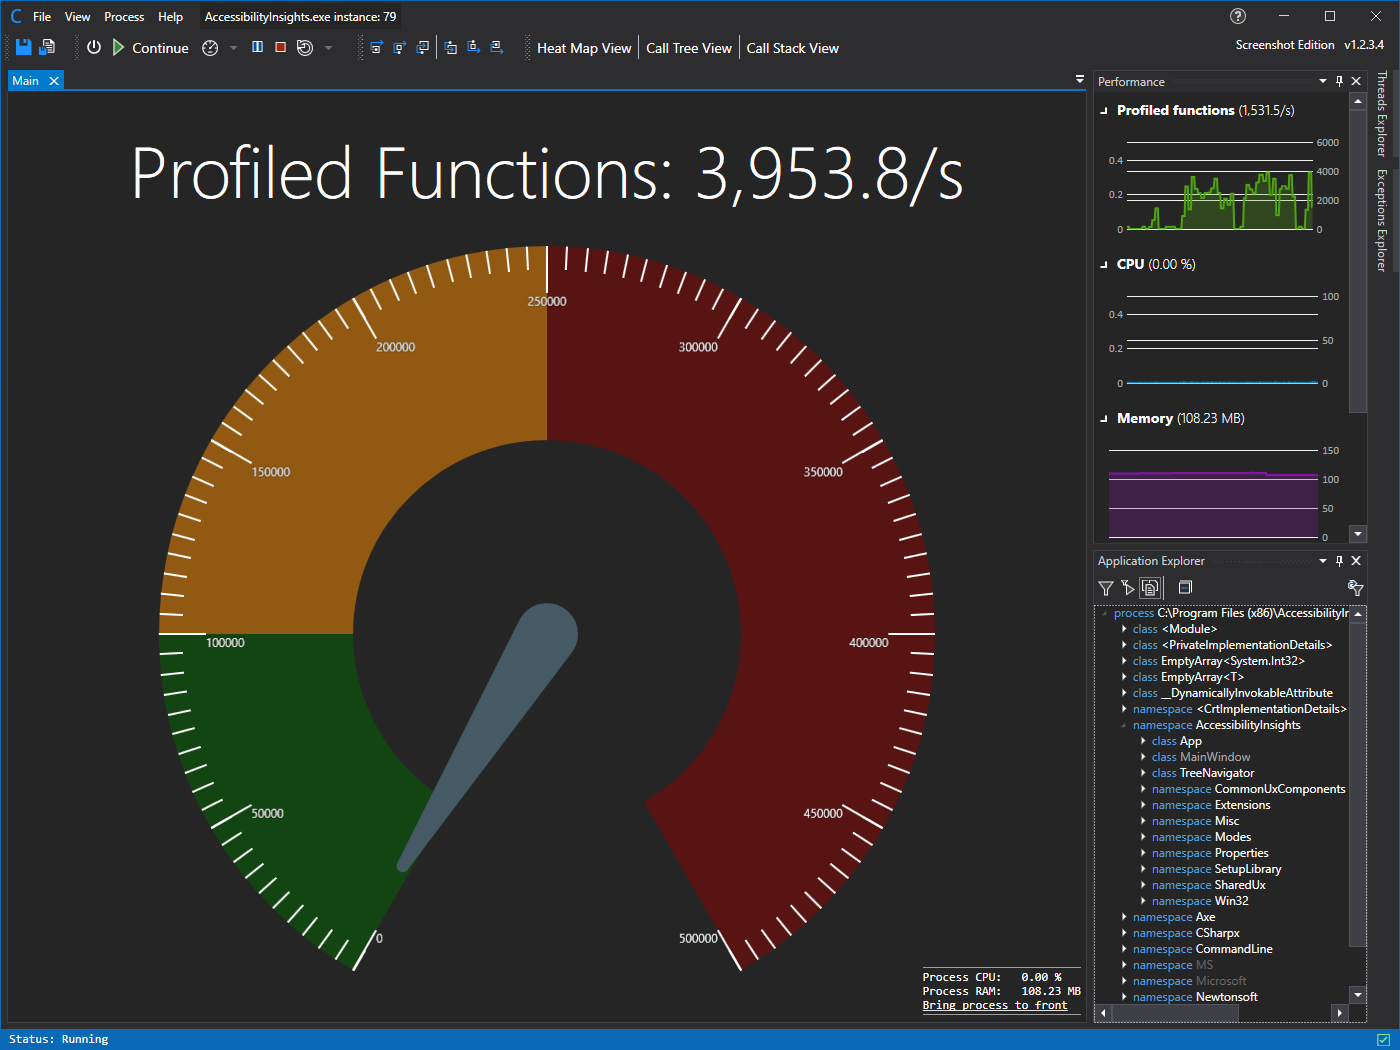
Tracing profiler without waiting, recording or logging.
* Experimental feature, as such, it is an Experimental Edition feature only for now.
CodeGlass has all kinds of features, head over to our GitHub Documentation Pages to see more.
Giving you direct access to the data without recording it first.
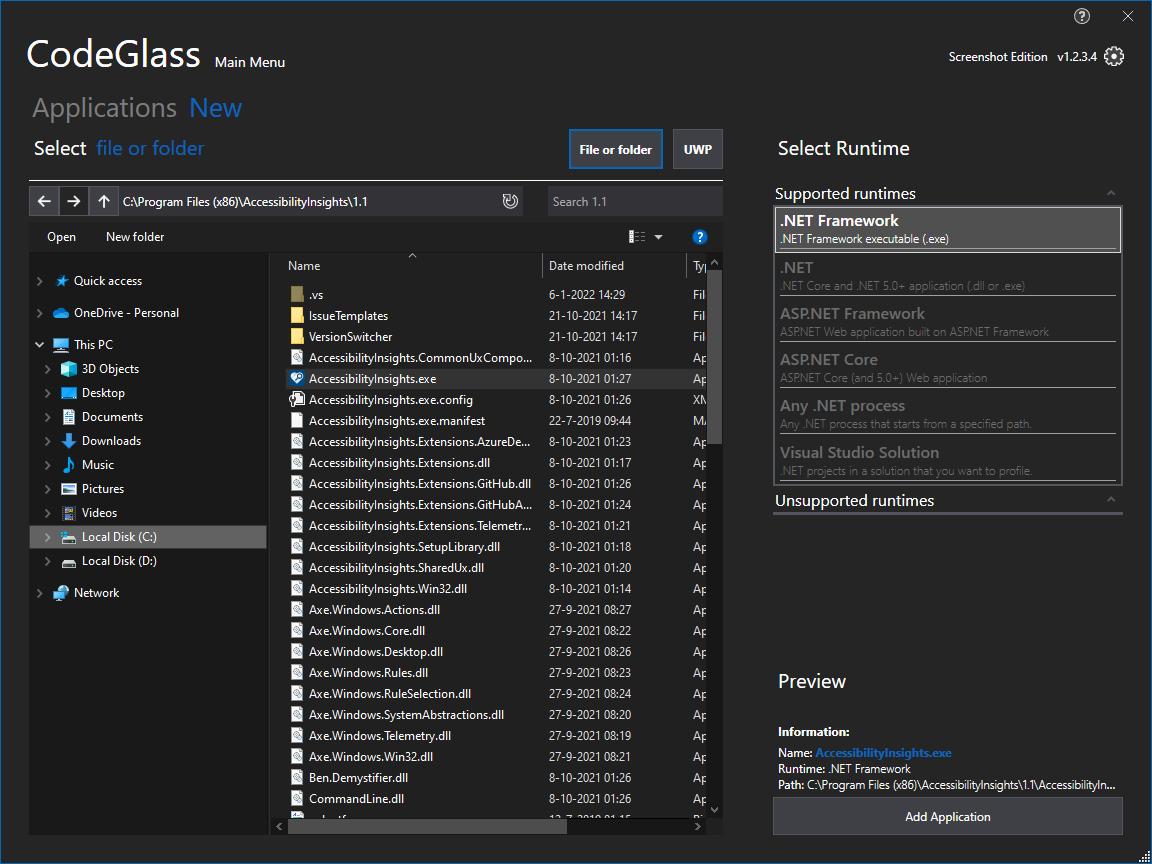
.Net Core, Framework, .NET 5+, ASP.NET and more!
Compare other snapshots to fix issues you never could.
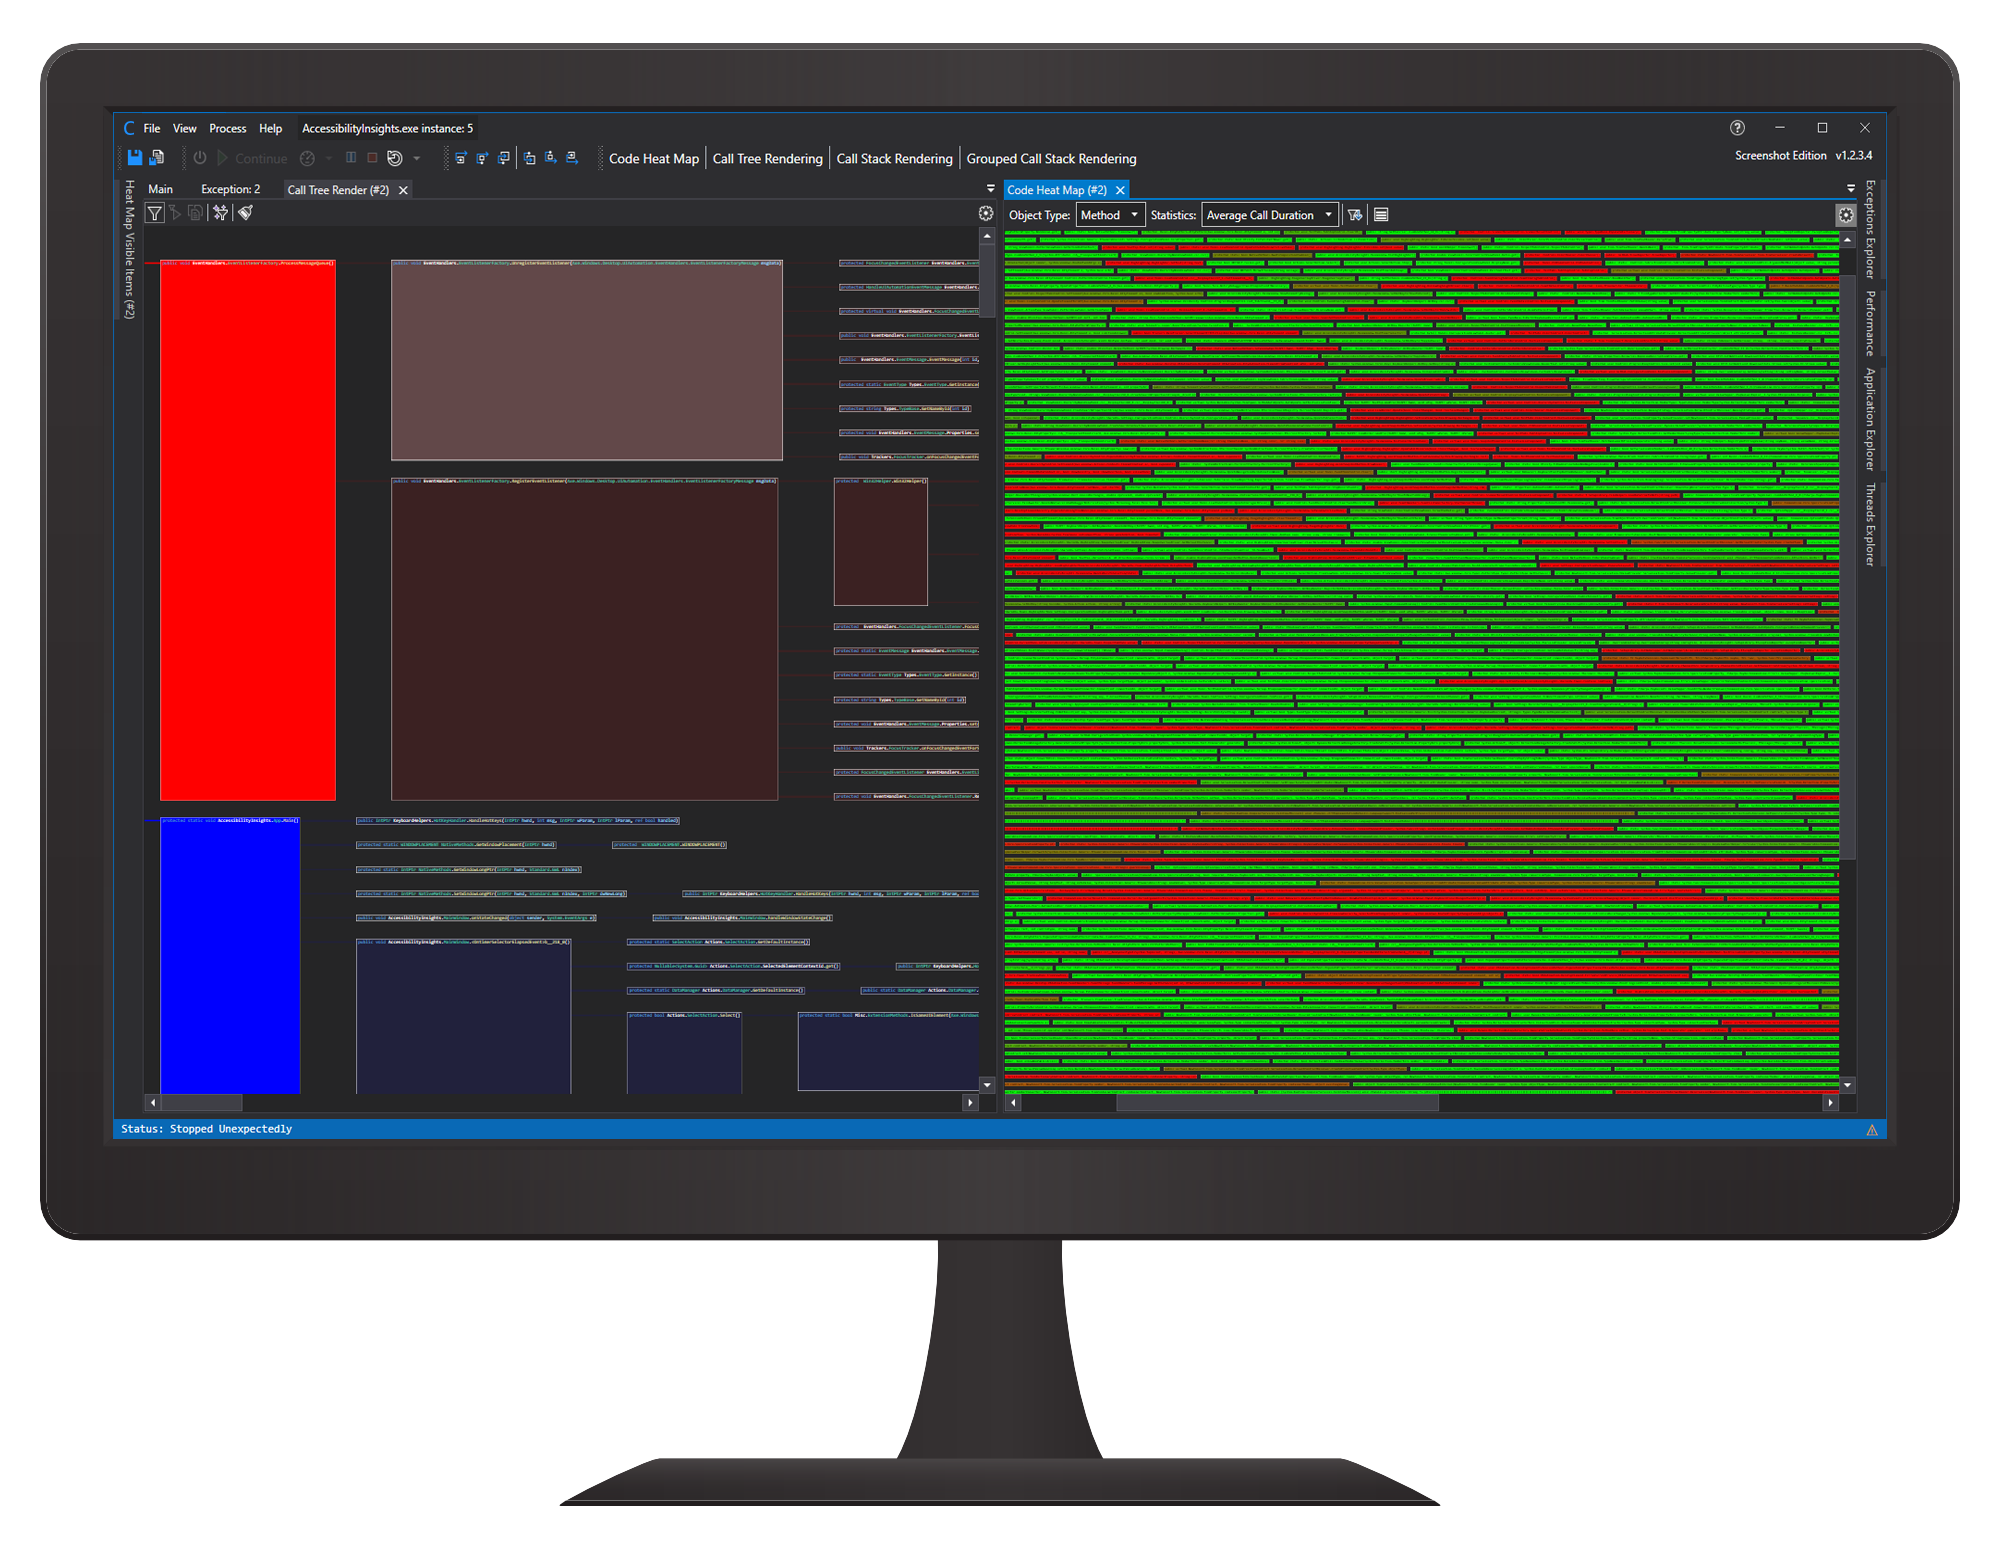
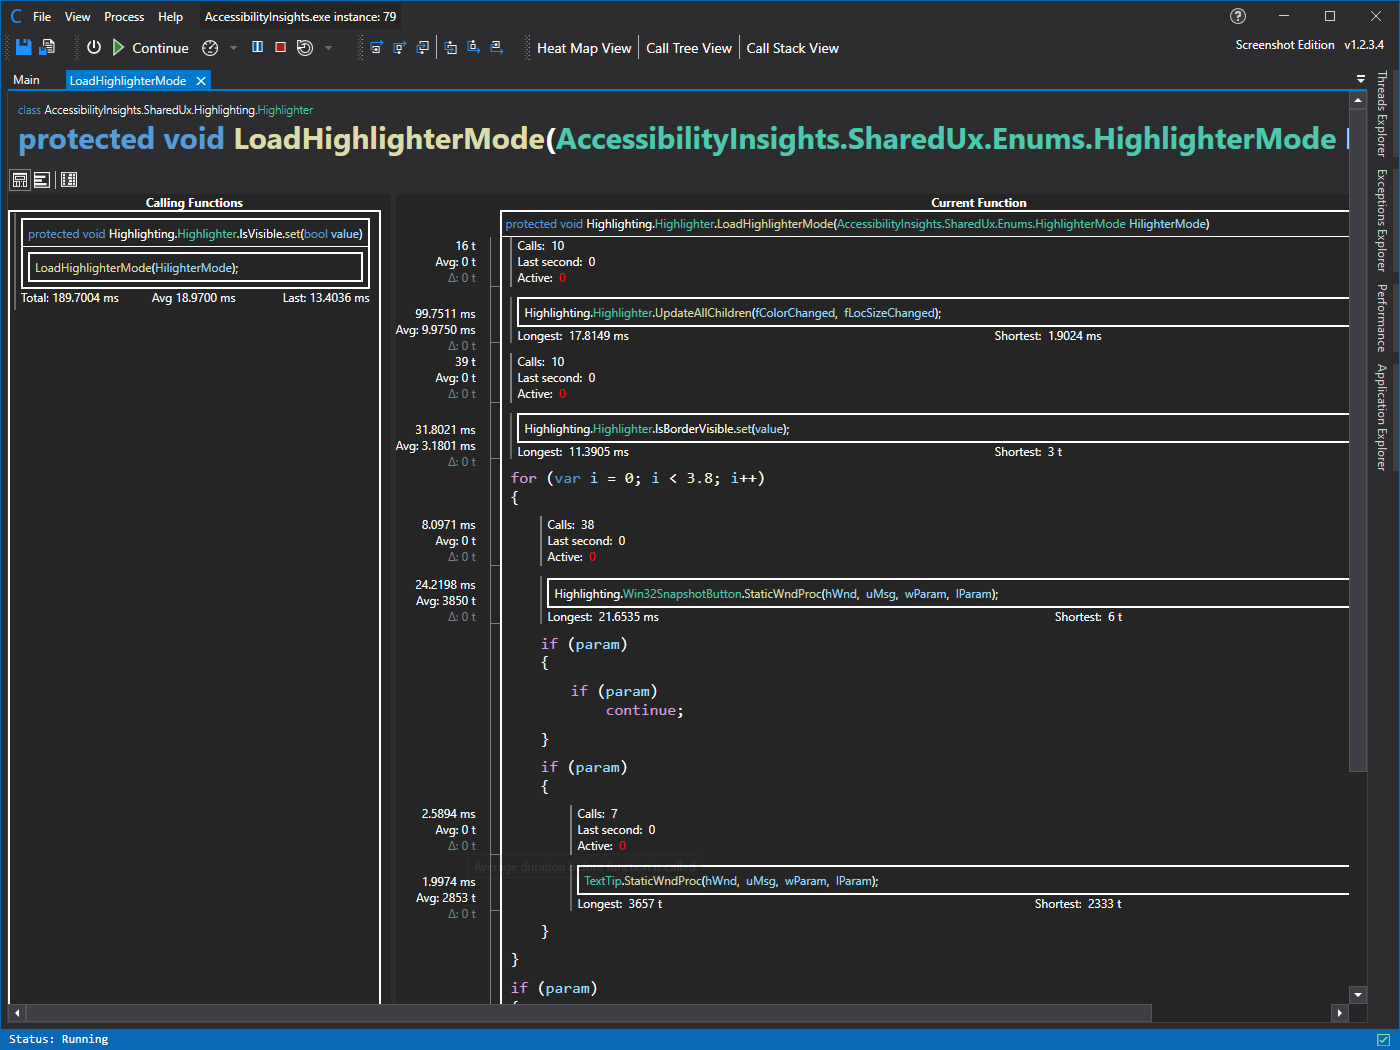
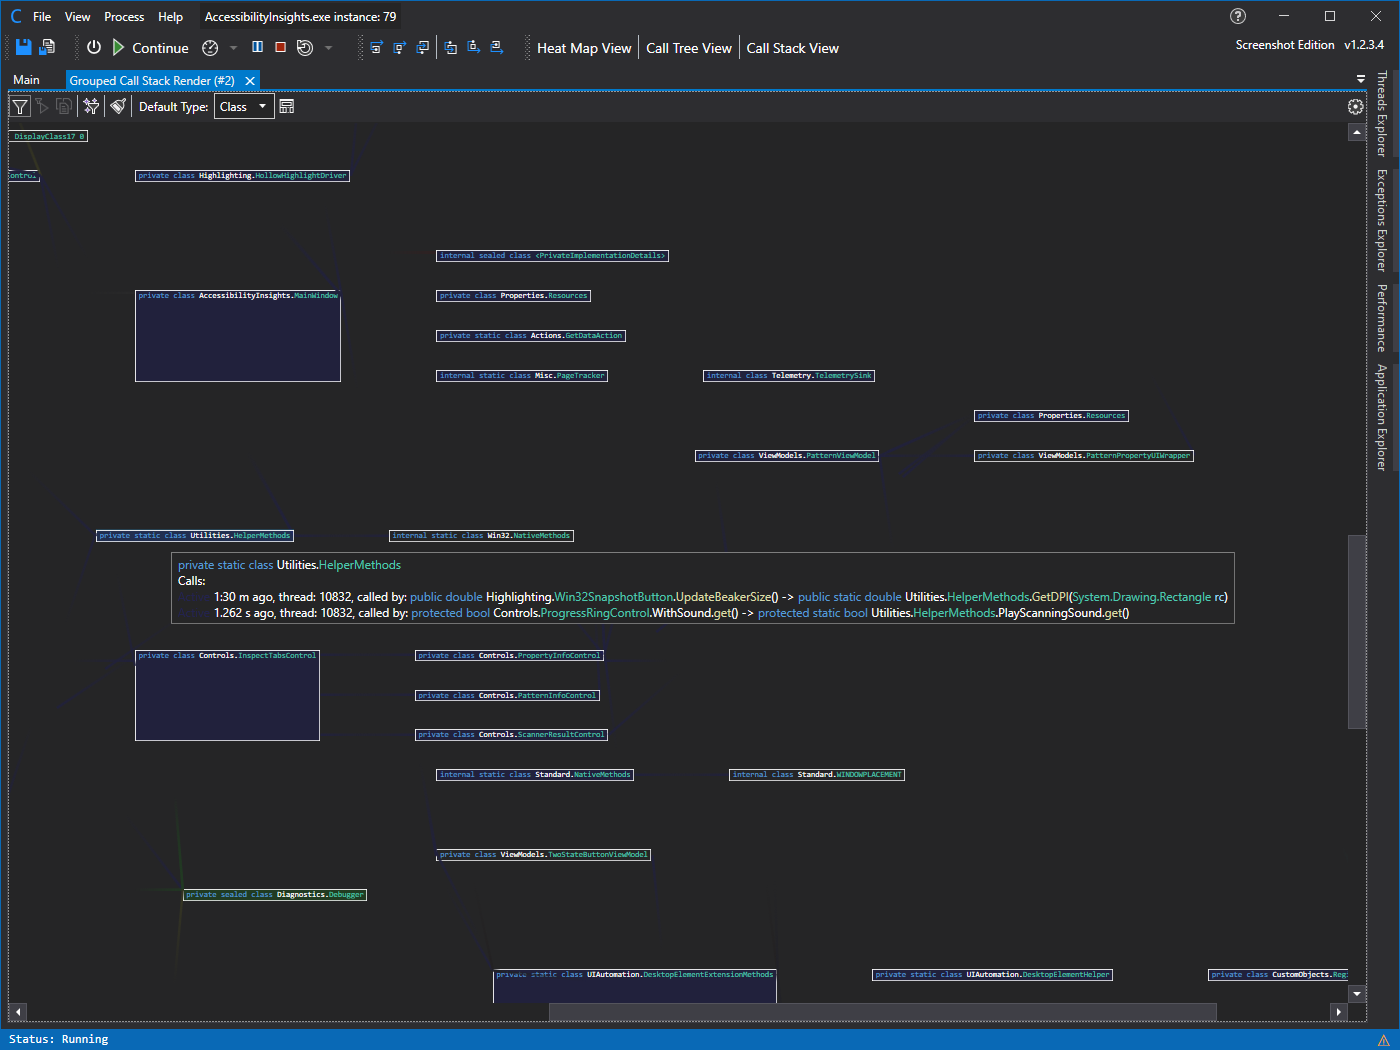
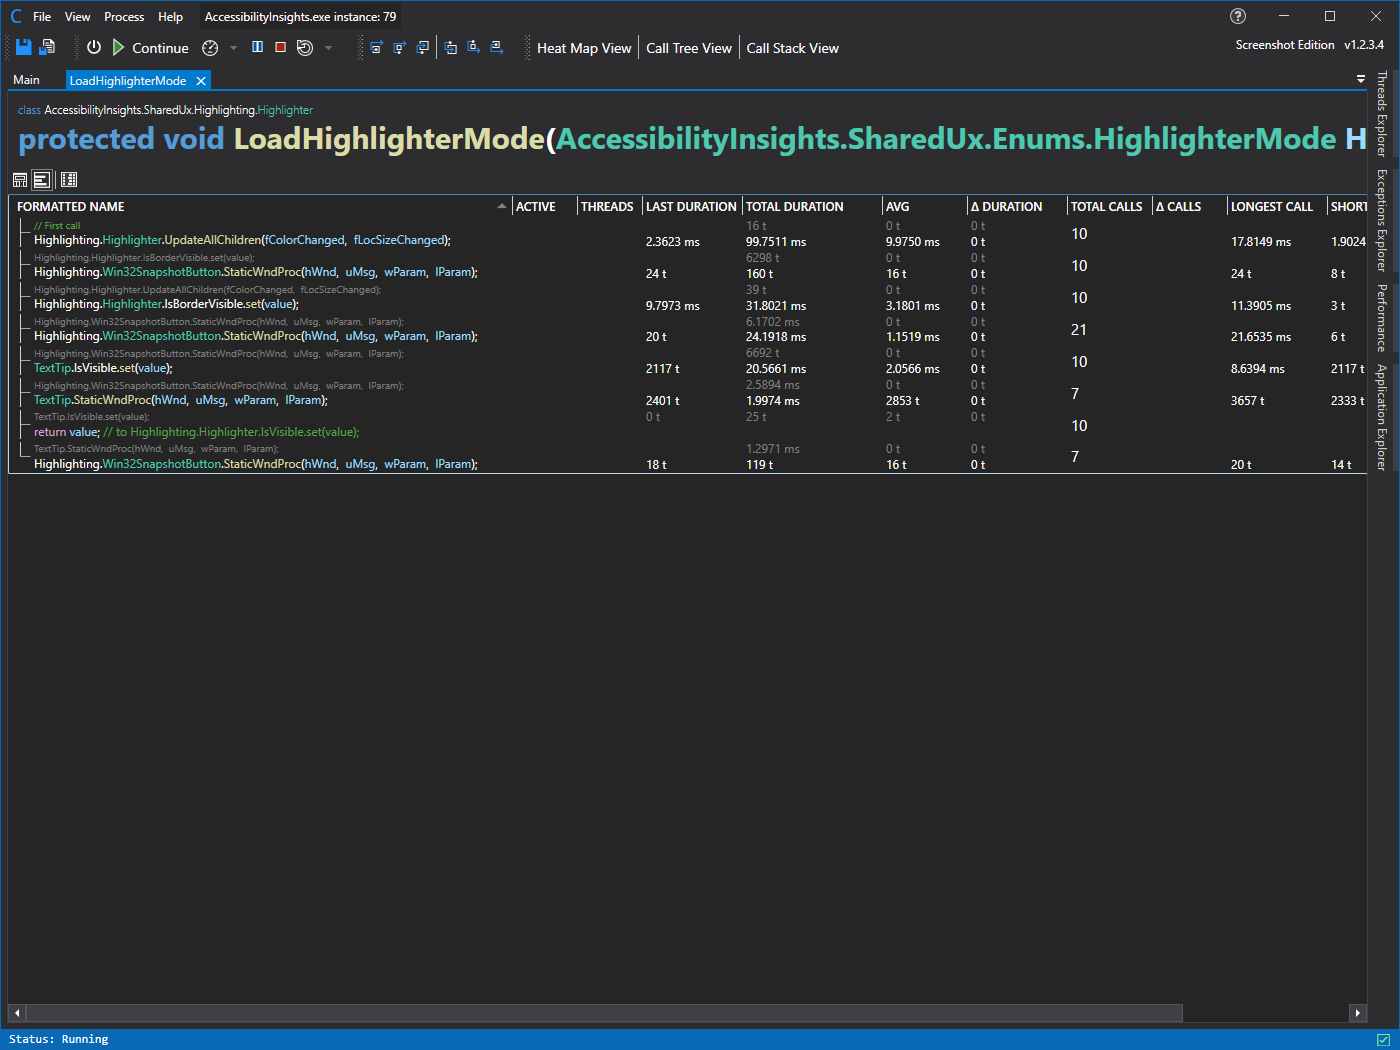
Reconstructing function code bodies to give you more in-depth data.
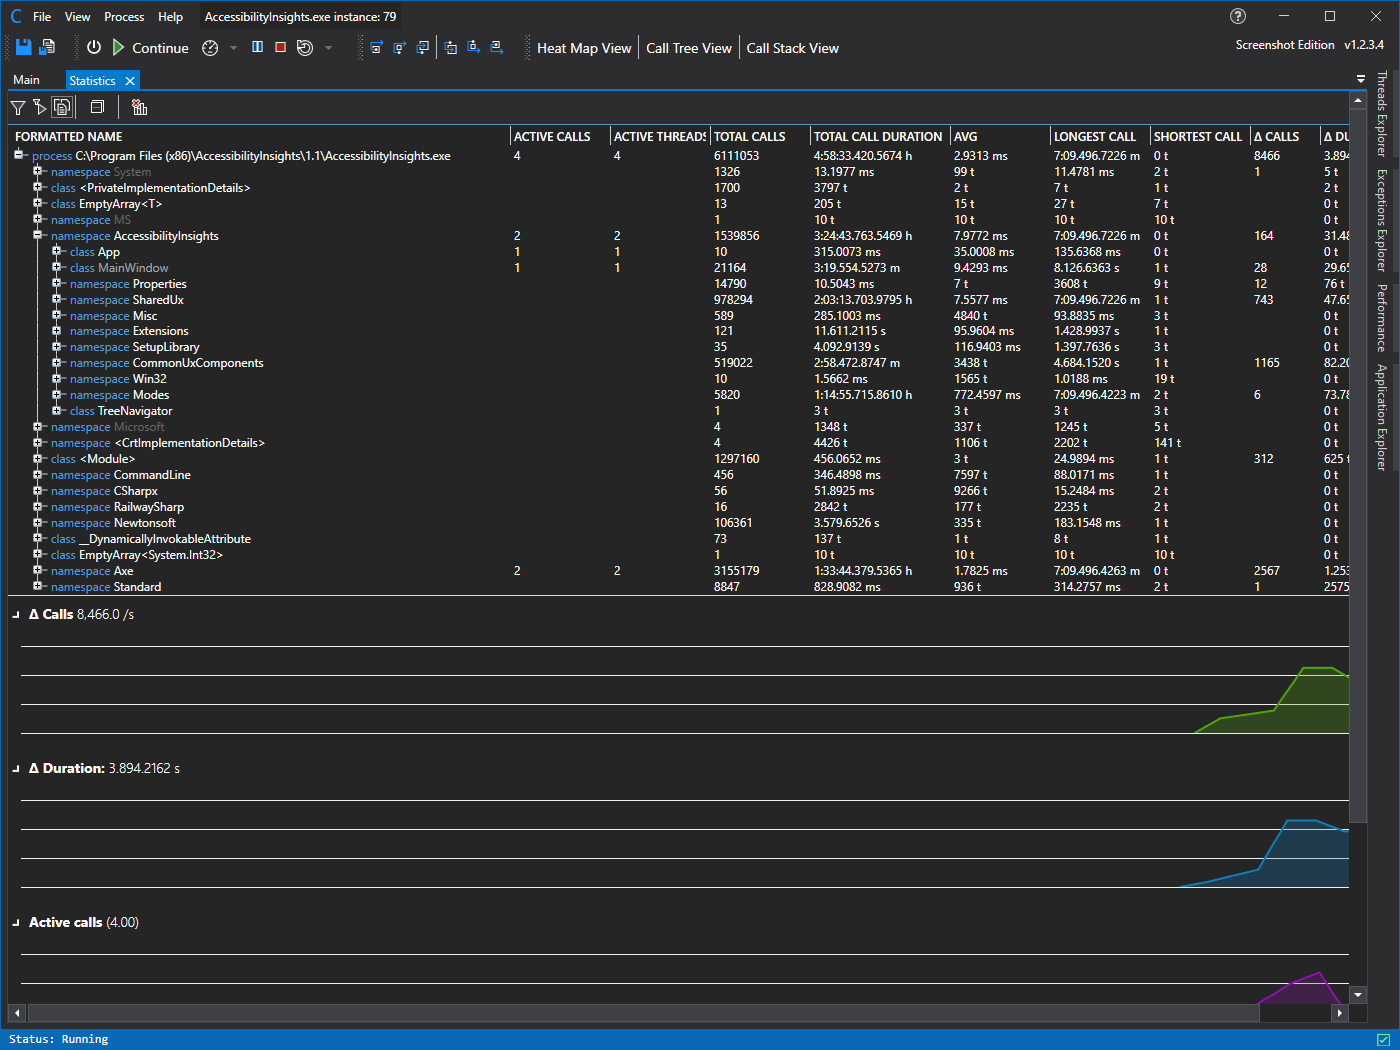
Function calls, duractions, threads, CPU, memory and more.
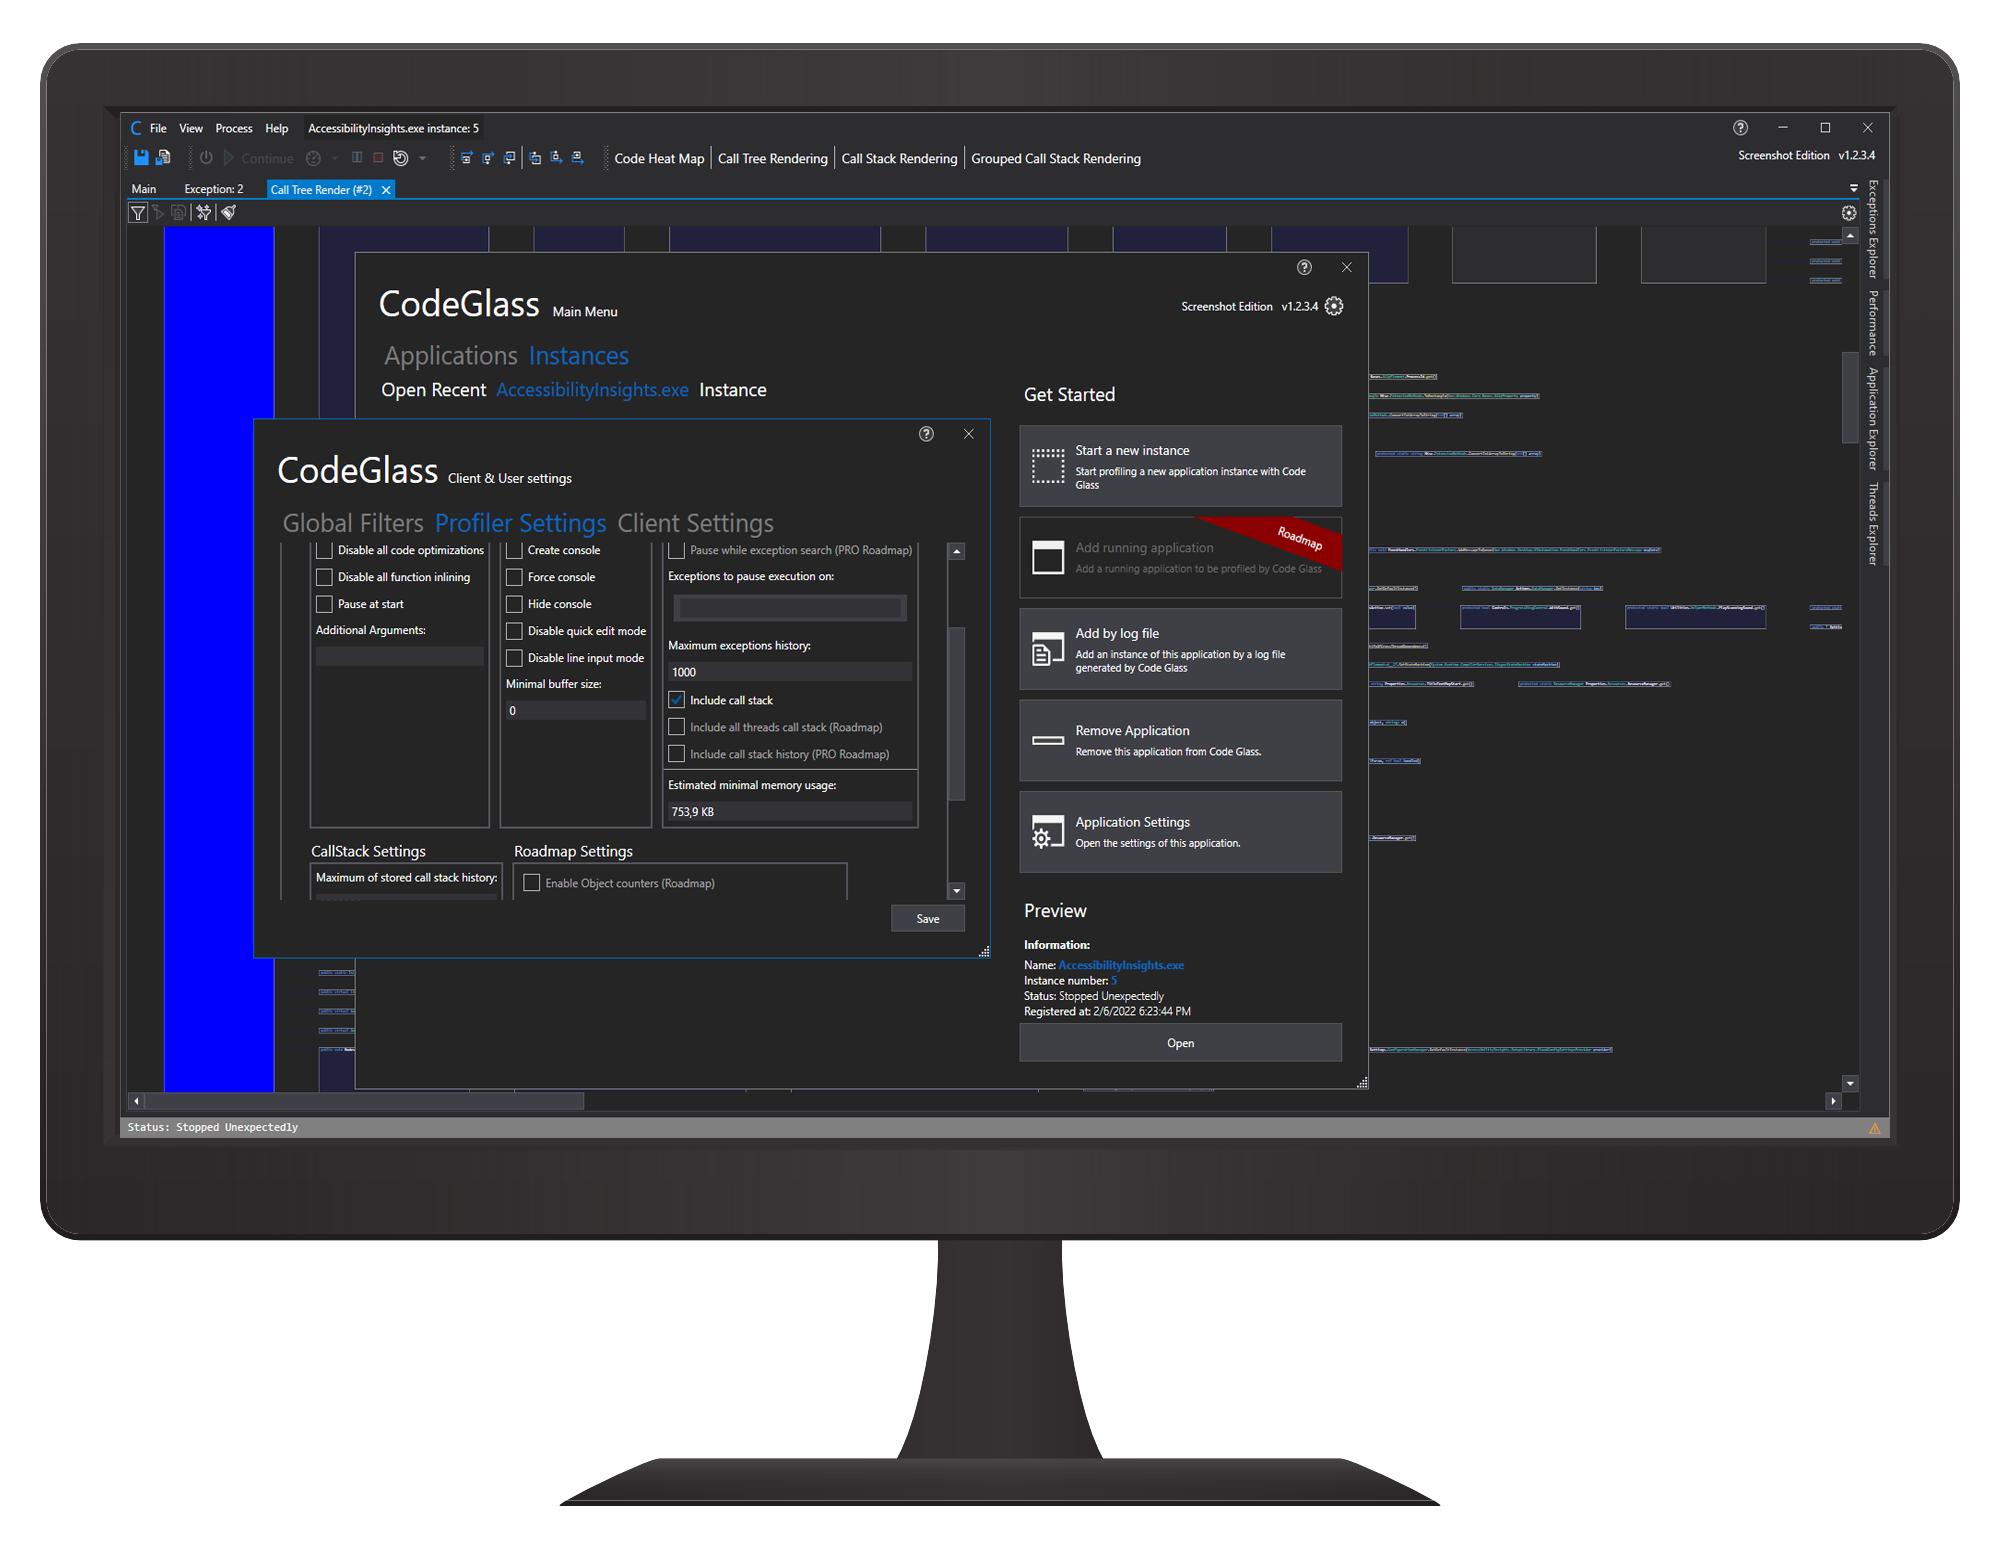
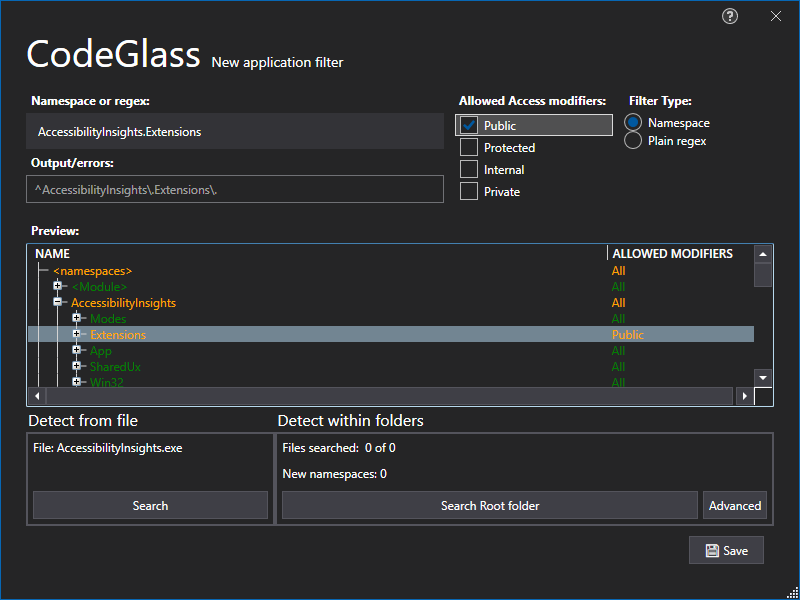
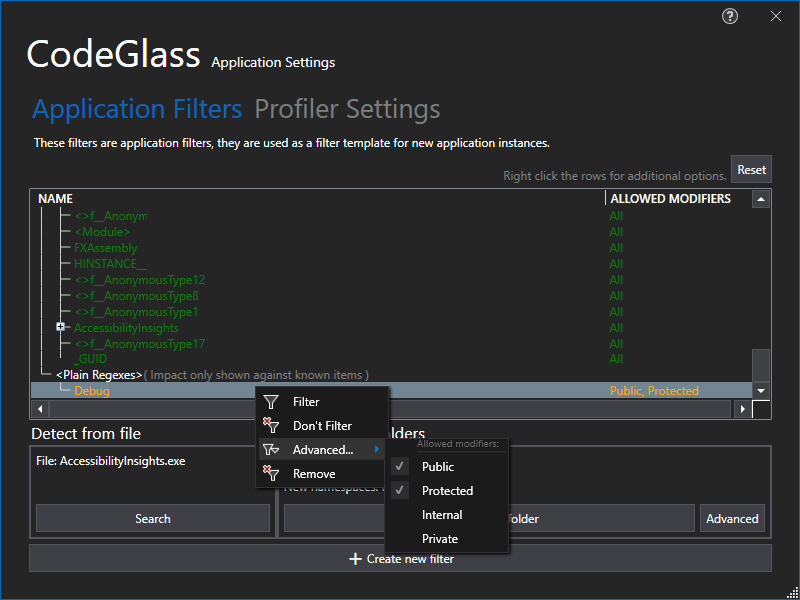
intuitive and straightforward to filter on the things you want to profile.
Control your application with start, pause, stop, restart, stepping, and standby.
This section was designed for a phone, but that does not really work for us.
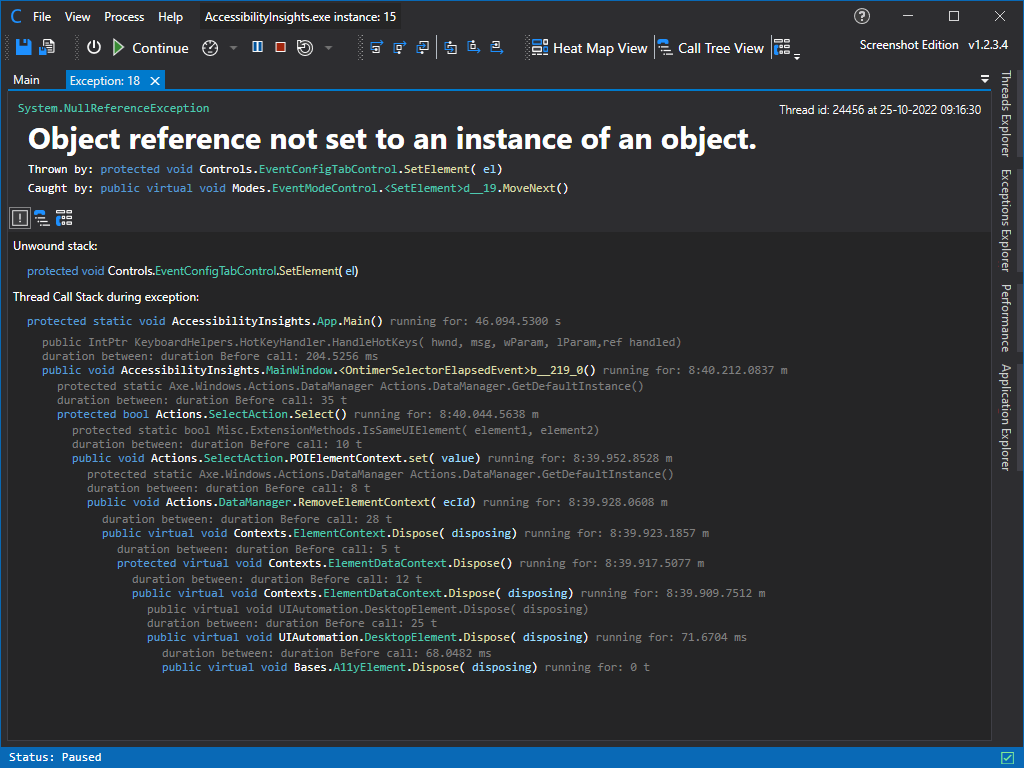
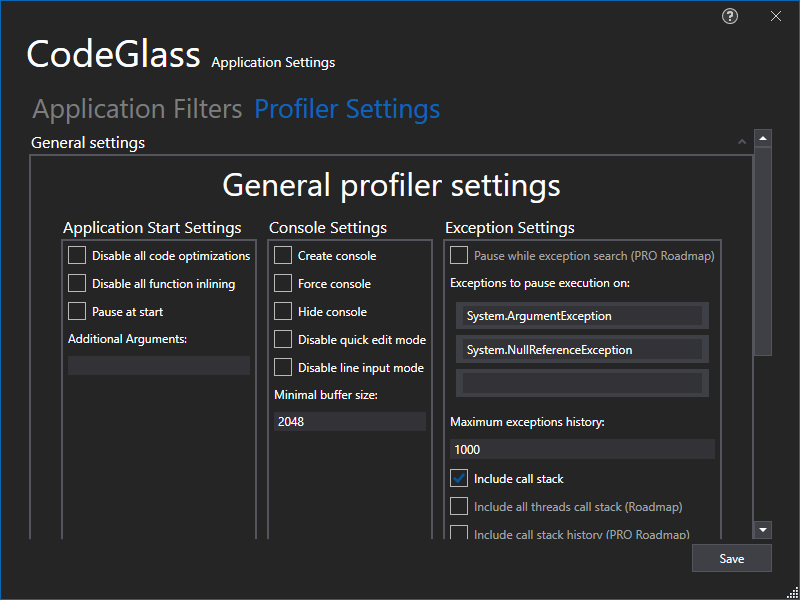
Collect any exception from your application.
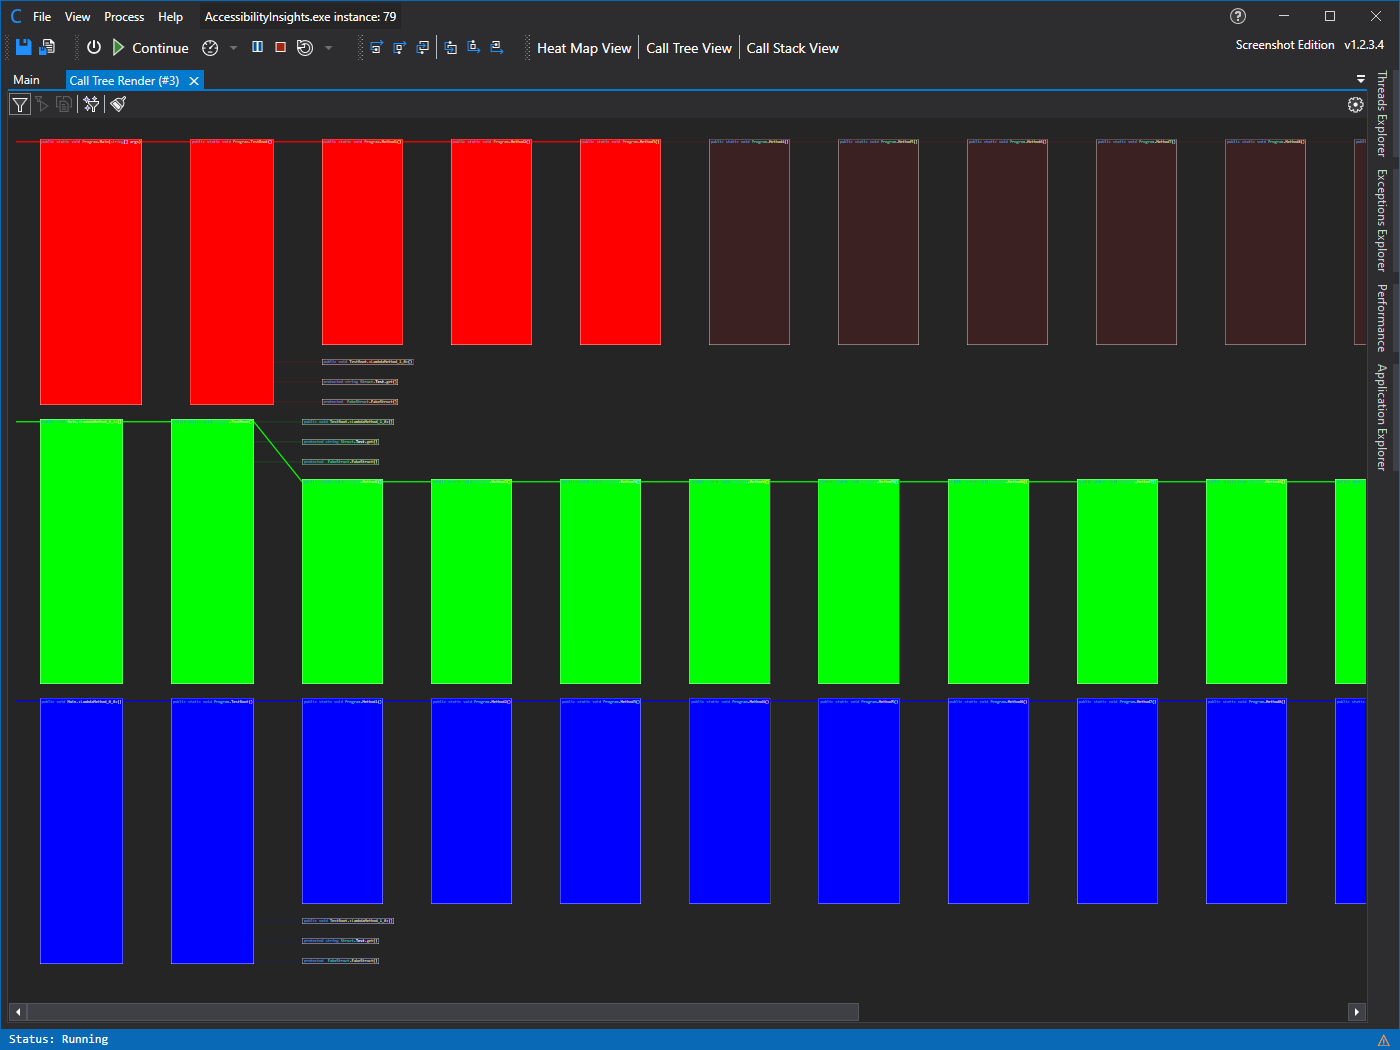
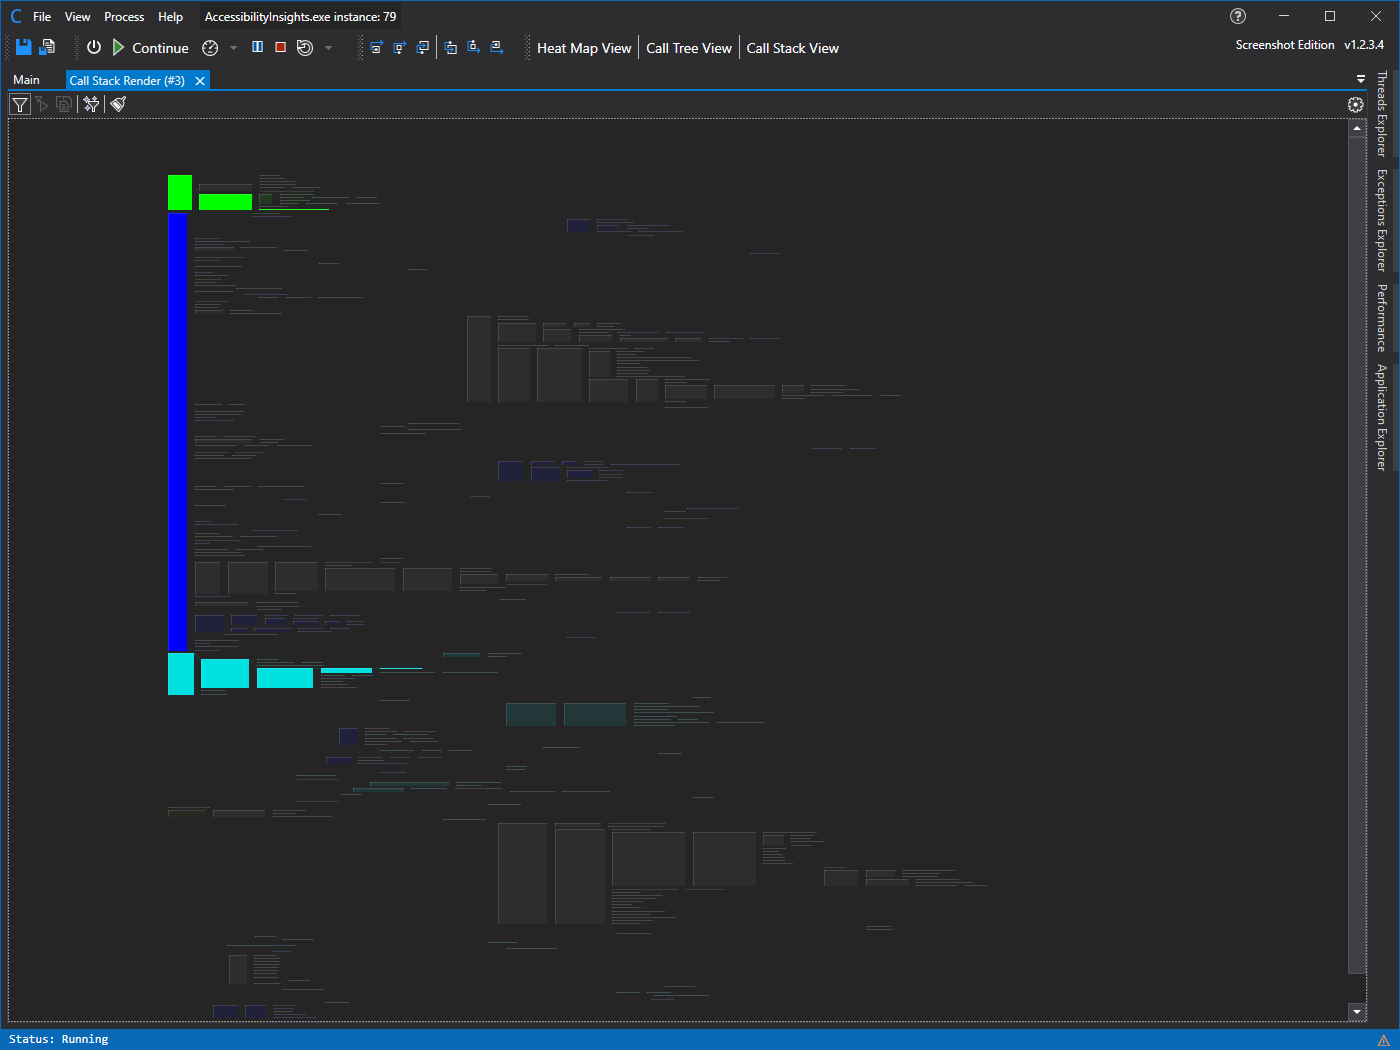
Direct insight into how your application works by rendering every step it takes.
JavaScript websites with NodeJS support coming soon!
You can use CodeGlass Remotely by connecting to other instances.
Step forwards or backwards to analyze your appliation at any point.
Or press F1 on any component in CodeGlass to get help.
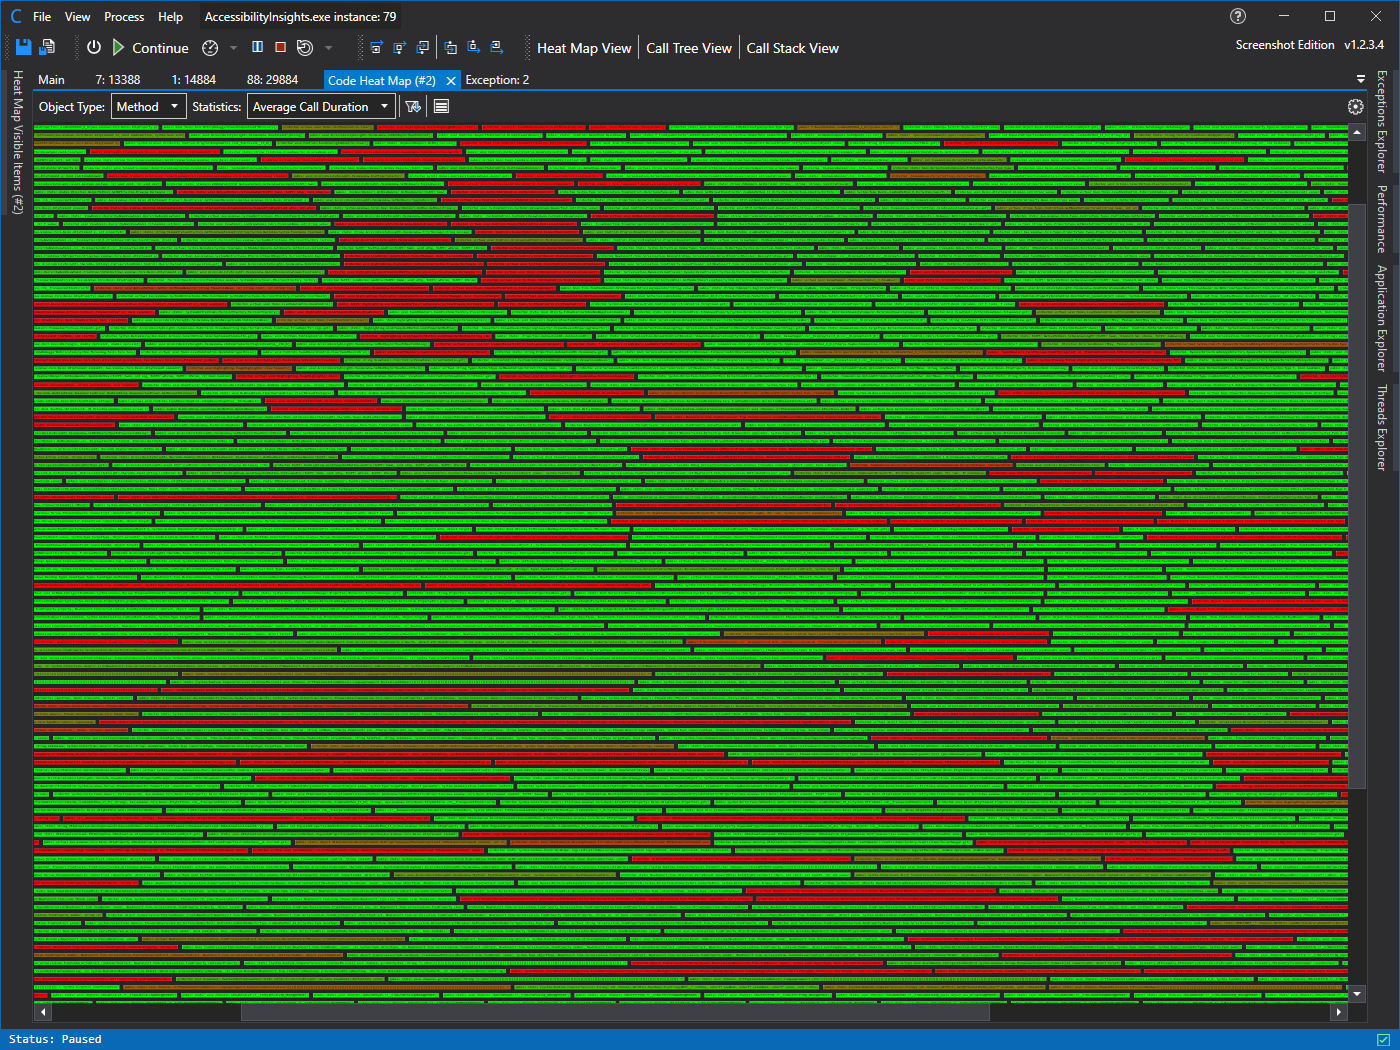
Shows you bad behaving code in one view based on the statistics.
Attach a console to any appliation, even if it did not have one.
We could not find appropriate ones, and these do look nice.
Automatically start profiling when you start debugging.
* Experimental feature, as such, it is an Experimental Edition feature only for now.
To get a taste of what CodeGlass is and can do, for more, see our collaborative GitHub documentation pages. No, the application is not 4:3; the screenshots are just like that
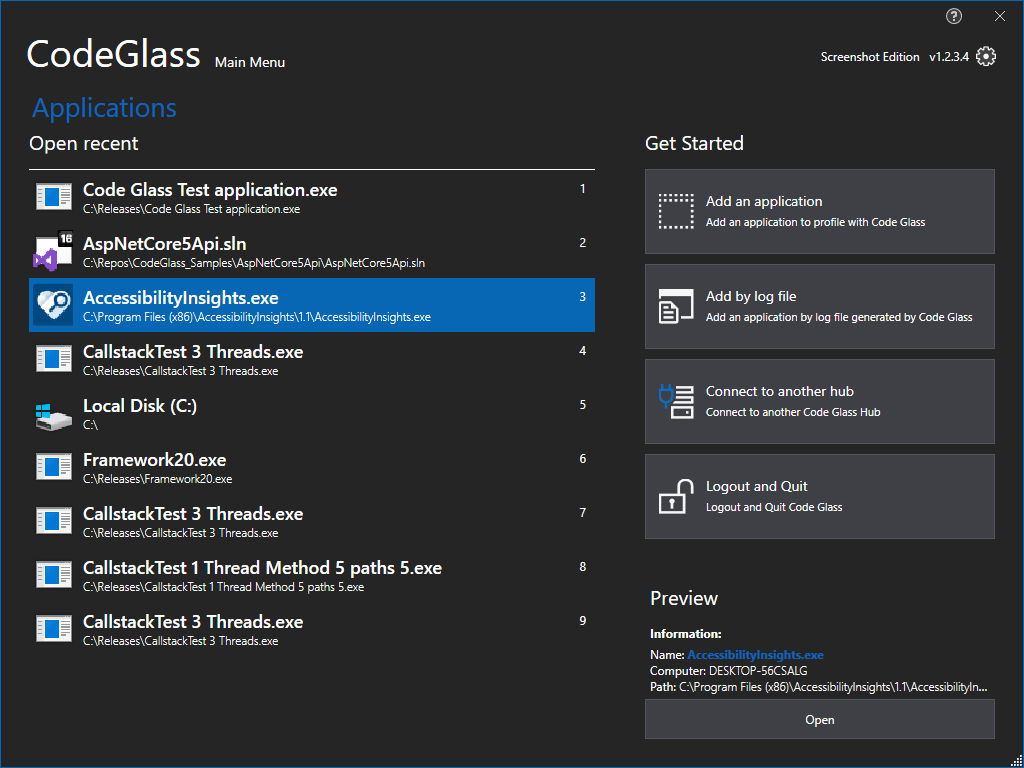
You can download CodeGlass directly from our Github page