Spend your time writing code, not maintaining and debugging it.
Using CodeGlass, you'll have real-time insights unlike anything out there. Without needing to have access or make changes to source code.
Effortless real-time performance statistics and memory insights, no stopwatches needed. Just launch CodeGlass.
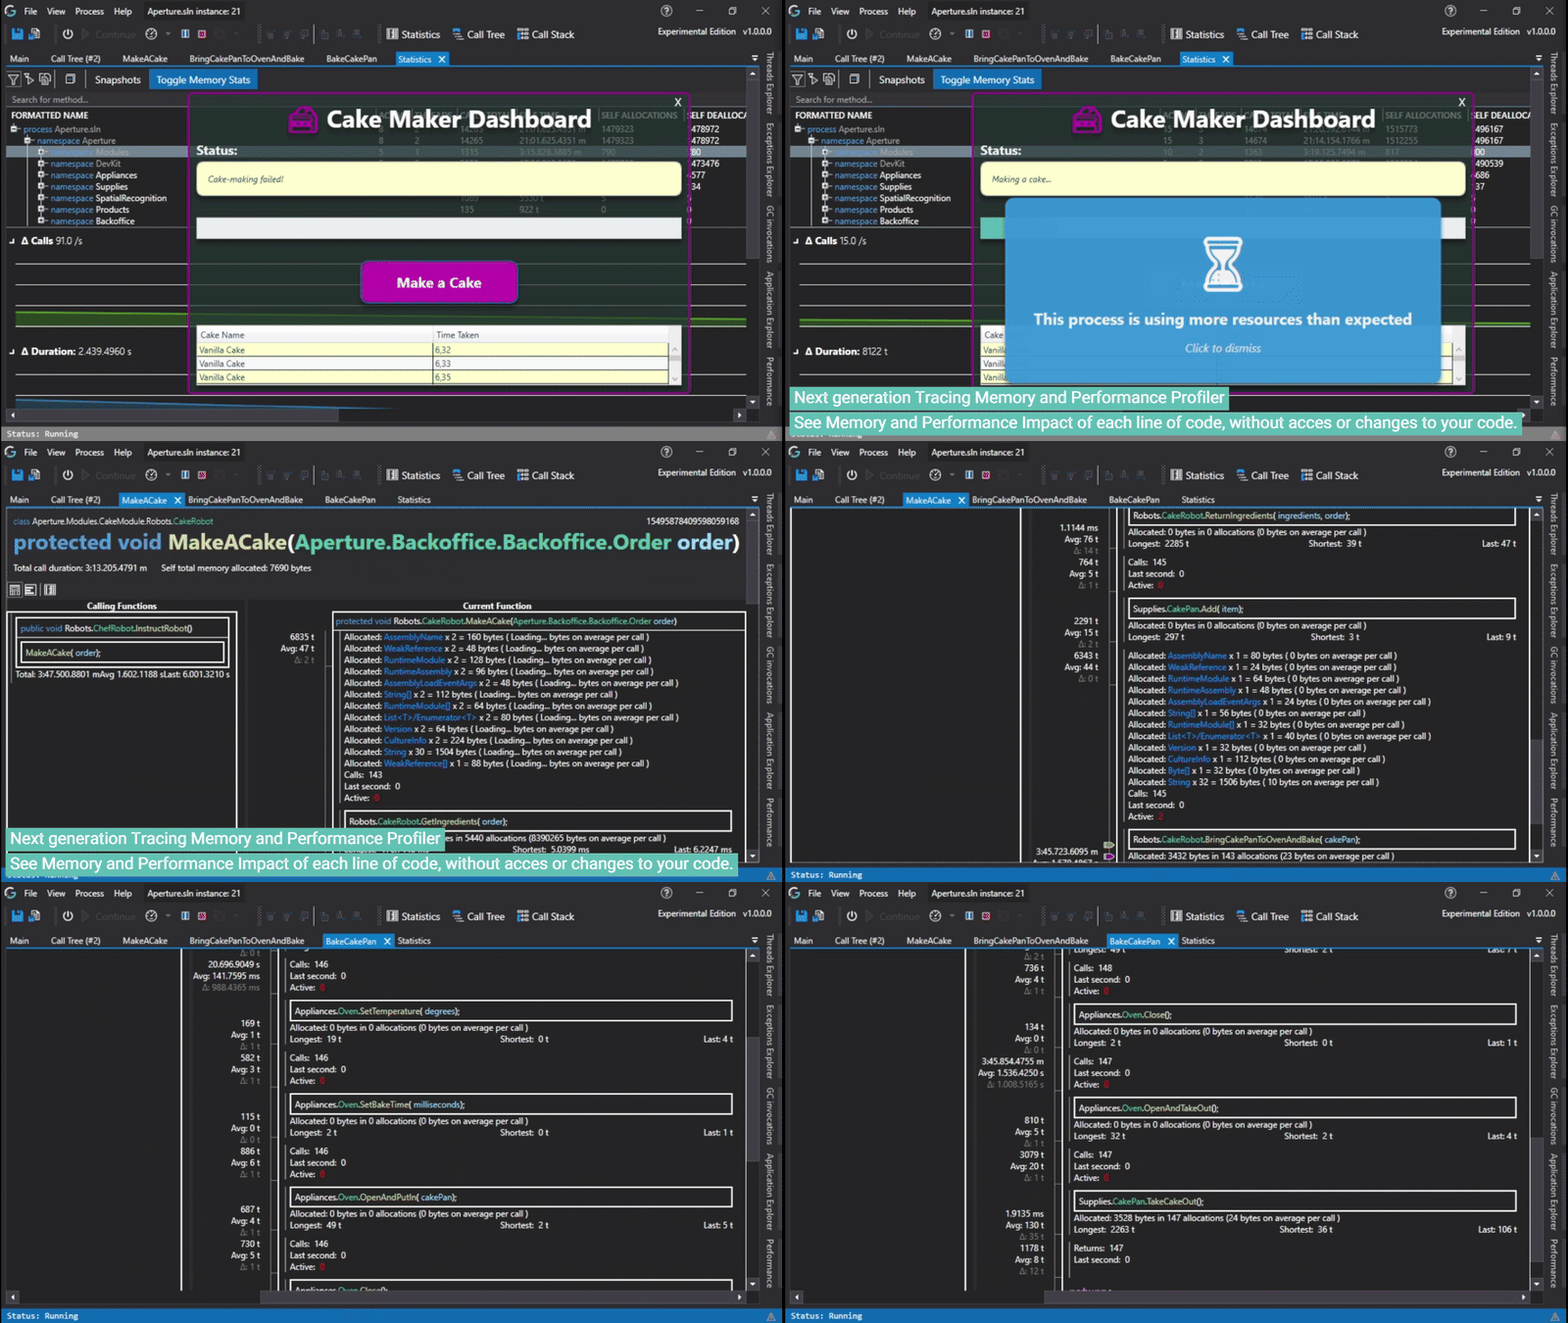
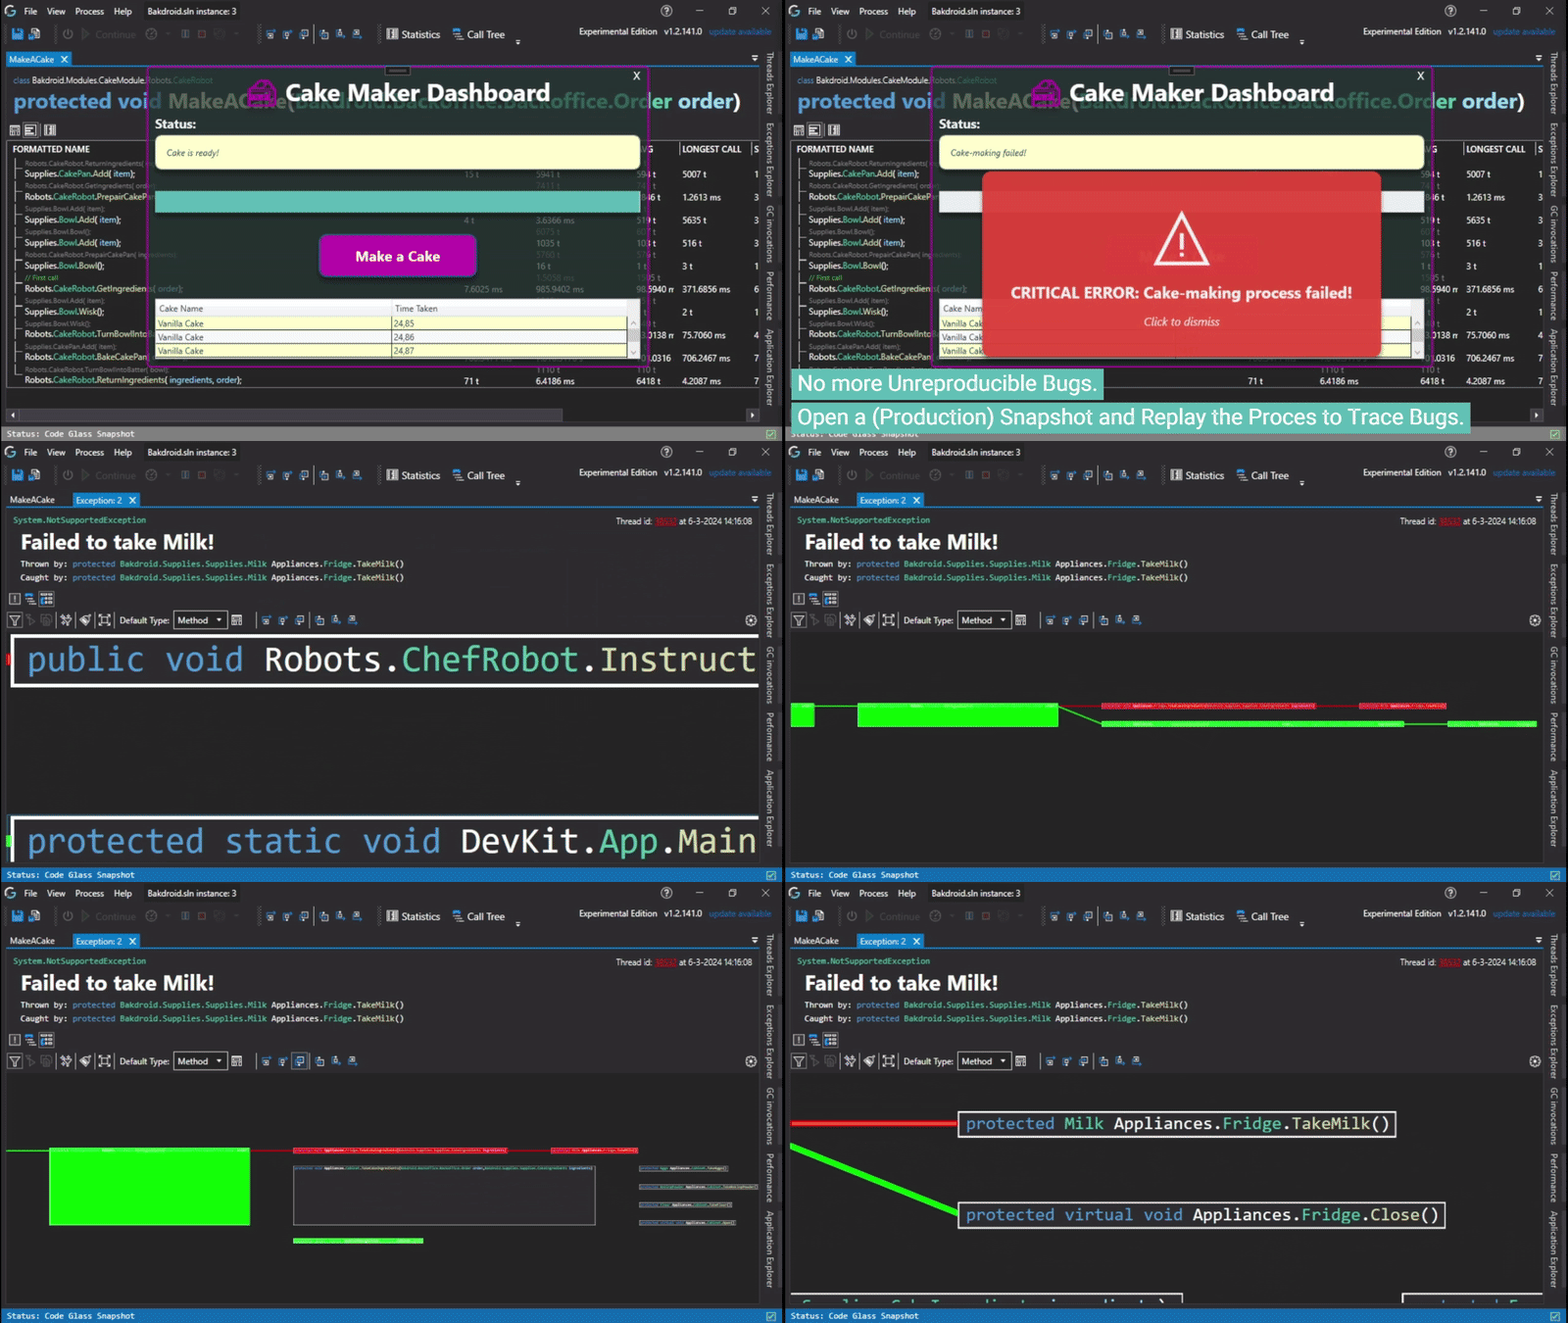
Real-time tracing profiler. Understand complex code bases easily.
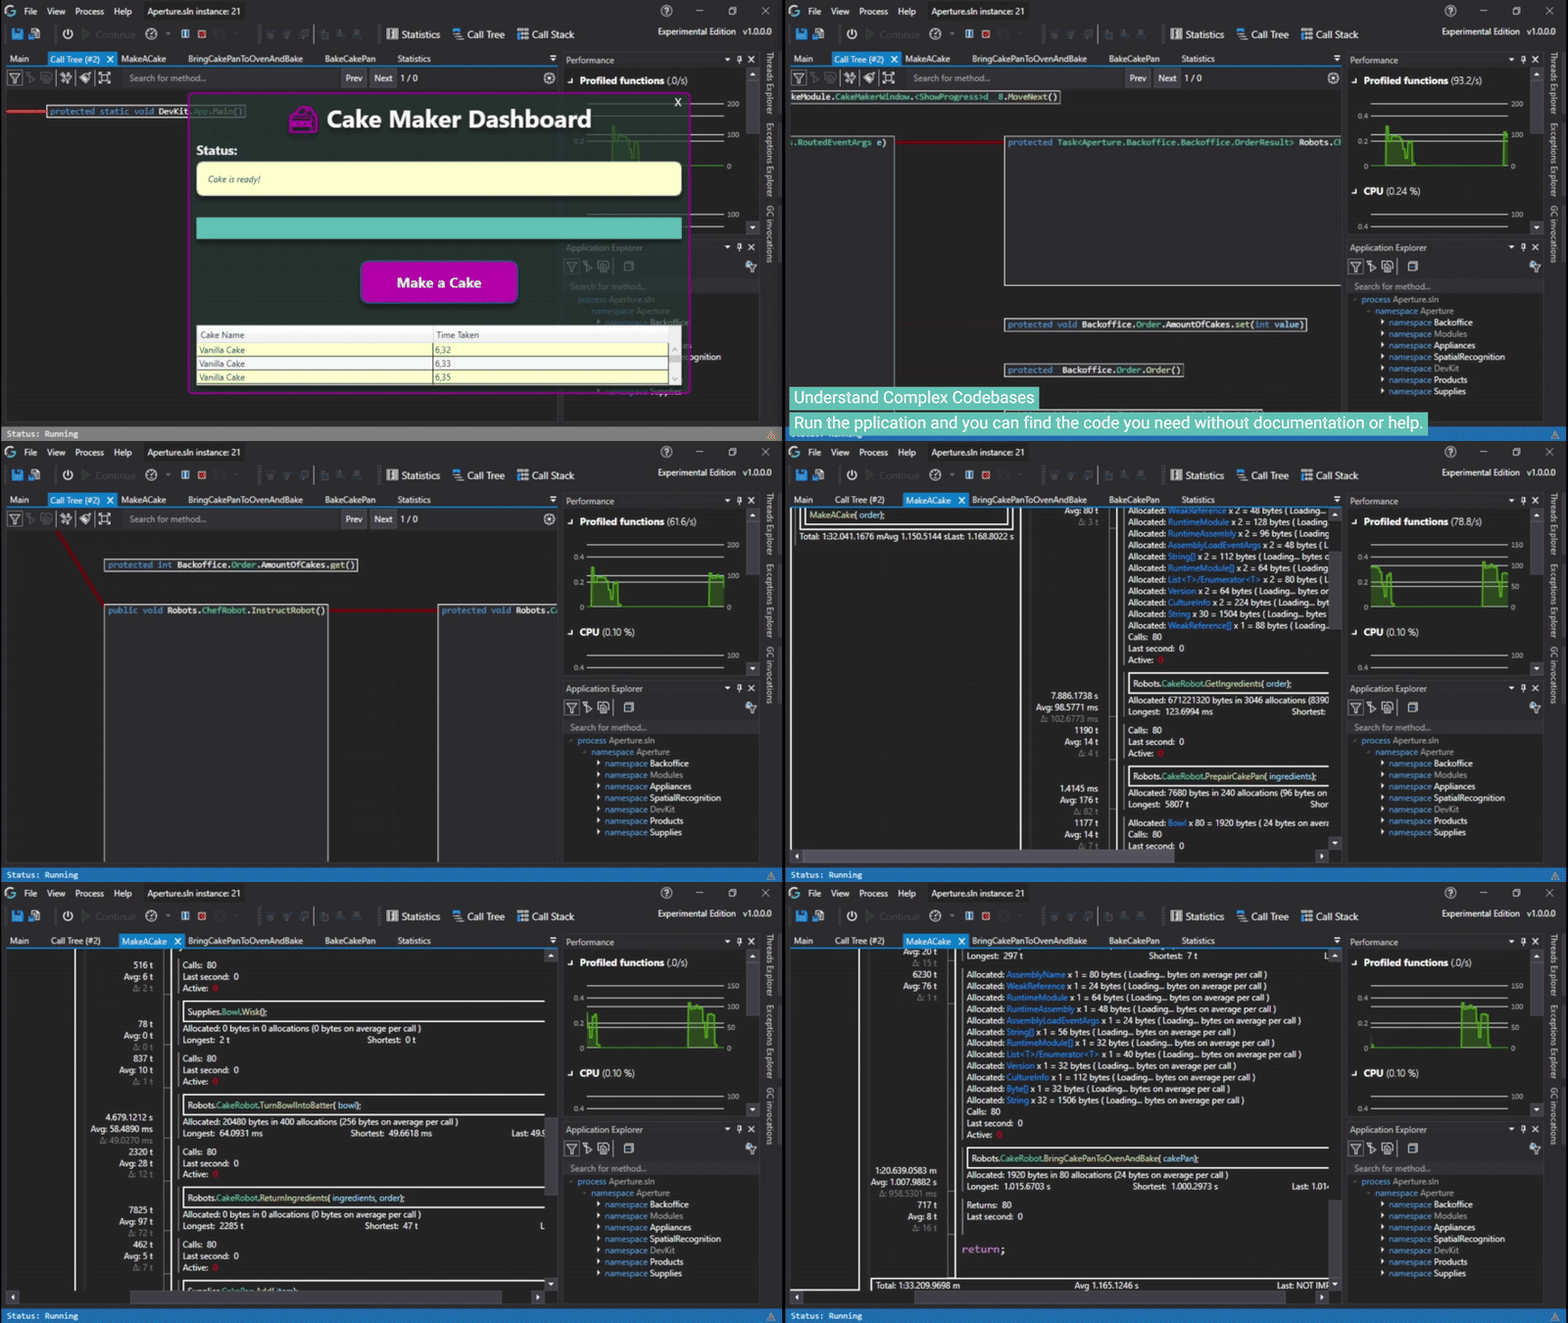

Create a snapshot and compare why it worked on your machine but not on another. See what led to the exception and if other threads are involved, and identify racing conditions.

CodeGlass makes it intuitive and straightforward to filter on the things you want to profile so you can focus on the data that matters. You can even make regex rules or only show the public functions.

Add your Visual Studio Solution to CodeGlass to use it automatically when you start the debugger.
*Experimental Only feature
Connect to other CodeGlass instances and use CodeGlass remotely. Like running it on a production server and just connecting your development machine to it. Or helping a college and not having to sit on his lap.
CodeGlass can collect and process over 8.000.000 unfiltered function calls per second. It depends on usage and your hardware, of course, but you do not have to notice any slowdown in your application by setting the correct filters. In most cases, CodeGlass can give you the results you need quicker than others.

CodeGlass gives you basic control like start, pause, stop and restart. But it also has advanced methods like stepping forwards and backwards, throttling and a profiler standby mode that gives you near the full performance of your application and allow you to start profiling again when you need it.

CodeGlass is a real-time code profiler that collects every call and giving you direct access to the data without analyzing it first. Its not sampling. With additional control like stepping, throttling, rendering, advanced filtering, code body reconstruction and more.

After 3 hours of troubleshooting without CodeGlass and still no further than we started, we found the issue in 30 seconds using CodeGlass. This included Starting CodeGlass and the troublesome application.
A background processing tool running in Azure was unknowingly using Azure resources. During the CG demo, we found out that this was going on, and that the tool was occupying 4 Azure cores. CodeGlass' insight lowered our monthly Azure bill.

We had a problem with a specific installation of our software. We tried everything to fix it, but after three days, we gave up and reinstalled the server it was running on. A year later, the problem came back, and with CodeGlass, we managed to find and fix the issue within 15 minutes.

On our first day using CodeGlass we already solved an issue in 10 minutes that we already spend 32 hours on.
Unlike many other profilers, CodeGlass is a real-time tracing code profiler that gives you line-by-line code statistics without changes or access to the source code. It also gives you this data in real-time without having to analyzing it first. With additional control like stepping, throttling, rendering, advanced filtering, code body reconstruction and more.
Unlike other SaaS based solutions, we don't collect any of your application data as CodeGlass runs fully Locally on the machine you want to use it on.
The only call to the outside CodeGlass makes is when you Login into CodeGlass to validate your license.
CodeGlass shows in real time how your code works. This can help when creating new documentation or when there is no existing documentation available.
There are multiple versions of CodeGlass available, each with their own price. Click here to check out the pricing.
CodeGlass can run anywhere where the runtime of your application can run. As long as you can access the Process, whether that be in development or in the cloud, you can run CodeGlass on it.
With properly setup filters your application will have no noticeable performance impact.
Without applying filters some large applications can notice a slowdown. But that is why we added the ability to add filters. The more you filter, the less CodeGlass has to profile, the less performance impact CodeGlass will have.
Good to note is that CodeGlass does also remove its overhead from the profiler statistics.
Welcome to CodeGlass, a groundbreaking software development tool from an innovative startup based in the Netherlands. Our mission is to provide the best tools for software developers, and CodeGlass is a shining example of that commitment.
An Intuitive, lightweight but powerful tool for and by developers.